
Please refer to important disclosures at the end of this report
1
Aster DM Healthcare Ltd (ADHL) is one of the largest private healthcare service
providers which operates in multiple GCC states and is an emerging hea
lthcare
player in India. ADHL
operates in all of the GCC states (UAE, Oman, Saudi Arabia,
Qatar, Kuwait, Bahrain and Jordan), India and the Philippines.
The company operates in multiple segments of the healthcare s
ervices industry,
including hospitals, clinics and retail pharmacies. As of September 30, 2017, the
Company had 17,408 employees including 1,417 full time doctors, 5,797 nurses,
1,752 paramedics, and 8,442 other employees (including pharmacists). GCC
operations are headquartered in Dubai, UAE, while
Indian operations are
headquartered in Kochi, Kerala.
Positives: (a) Diversified revenue sources from hospitals, clinics and pharmacies
(b)
Long standing presence with established brand equity and positioning (c)
Ability to
attract and retain high quality medical professionals (d) Experienced c
ore
management team
Investment concerns:
(a) In 1HFY2018, the company’s 81% revenue came from
GCC region and balance from India, reflecting geographical concentration ri
sk (b)
Despite strong revenue CAGR of ~24% over FY15-
17, ADHL has seen fluctuation
in profitability and reported loss in 1HFY18 due to instability in operating margins
(c) In the past, the company has suffered losses from Sanad Hospital, Saudi Arabia
which
had higher exposure in revenue from government, however the company
has reduced the revenue exposure from 82% in FY16 to 38% in FY17.
Outlook & Valuation: In terms of valuations, the pre-
issue EV/EBITDA works out to
32.5x its 1HFY2018 annualized EBITDA (a
t the upper end of the issue price band),
which is higher compared to its peers like Apollo Hospitals Enterprise (
trading at PE
22.3x -1HFY2018 annualized EBITDA). On EV/ Bed basis, ADHL is `2.4cr vs
Apollo Hospitals Enterprise’s `1.7cr. Further, last thre
e years’ financial
performance including 1HFY18 numbers doesn’t provides confidence.
Hence, we
recommend Neutral rating on the issue.
Key Financials
Y/E March (` cr)
FY2015 FY2016
FY2017
1HFY18
Net Sales 3,876 5,250
5,931
3,123
% chg - 35.5 13.0
-
Net Profit 272 8
267
(83)
% chg - (97.0) 3,148.7
-
OPM (%) 13.1 8.5 5.6 5.7
EPS (Rs)
6.7
0.2 6.6
(2.1)
P/E (x) 28.2 933.0 28.7
-
P/BV (x) 3.4 12.8 3.4
-
RoE (%) 12.1 1.4 11.9
-
RoCE (%) 11.5 5.4 0.2
-
EV/Sales (x) 2.1 2.0 1.7
-
EV/EBITDA (x) 16.1 23.4 30.3
-
Angel Research; Note: Valuation ratios based on pre-issue outstanding shares and at upper end
of the price band
Neutral
Issue Open: Feb 12, 2018
Issue Close: Feb 15, 2018
QIBs 50% of issue
Non-Institutional 15% of issue
Retail 35% of issue
Promoters 37.4%
Others 62.6%
Post Issue Shareholding Pattern
Post Eq. Paid up Capital:
`505
cr
Issue size (amount): **
`980
cr (Inculde
offer for sale -
`255
)
Price Band:
`180
-190
Lot Size: 78 shares and in multiple
thereafter
Post-issue implied mkt. cap: *
`9,094
cr
- **
`9,599
cr
Promoters holding Pre-Issue: 43.3%
Promoters holding Post-Issue: 37.4%
*Calculated on lower price band
** Calculated on upper price band
Book Building
Fresh issue:
`725
cr
Issue Details
Face Value:
`10
Present Eq. Paid up Capital:
`467
cr
Amarjeet S Maurya
+022 39357600, Extn: 6831
amarjeet.maurya@angelbroking.com
Aster DM Healthcare Ltd
IPO Note | Healthcare
Feb 08, 2018
Aster DM Healthcare Limited |
IPO Note
Feb 08, 2018
2
Company background
Incorporated in 1987, Aster DM Healthcare Ltd is Kochi, Kerala based healthcare
service provider with operations in GCC states (United Arab Emirates, Oman,
Saudi Arabia, Qatar, Kuwait and Bahrain), India and the Philippines. Company’s
Indian operations are headquartered in Kochi, Kerala.
Aster DM Healthcare operates in multiple segments of the healthcare industry
including hospitals, clinics and retail pharmacies. Company operates hospitals and
clinics, pharmacies, diagnostic centers, educational institutions, healthcare
management and healthcare support systems. Company provides healthcare
services to patients across economic segments under brand names including
"Aster", "Medcare" and "Access".
Aster's healthcare facilities consists of 9 hospitals, 90 clinics and 206 retail
pharmacies in the GCC states, 10 multi-specialty hospitals and 7 clinics in India,
and 1 clinic in the Philippines as of September 30, 2017. Aster's had 17,408
employees as of September 30, 2017, including 1,417 full time doctors, 5,797
nurses, 1,752 paramedics and 8,442 other employees (including pharmacists).
Aster's hospitals in India are located in Kochi, Kolhapur, Kozhikode, Kottakkal,
Bengaluru, Vijayawada, Guntur, Wayanad and Hyderabad, and are generally
operated under the Aster, MIMS, Ramesh and Prime brands.
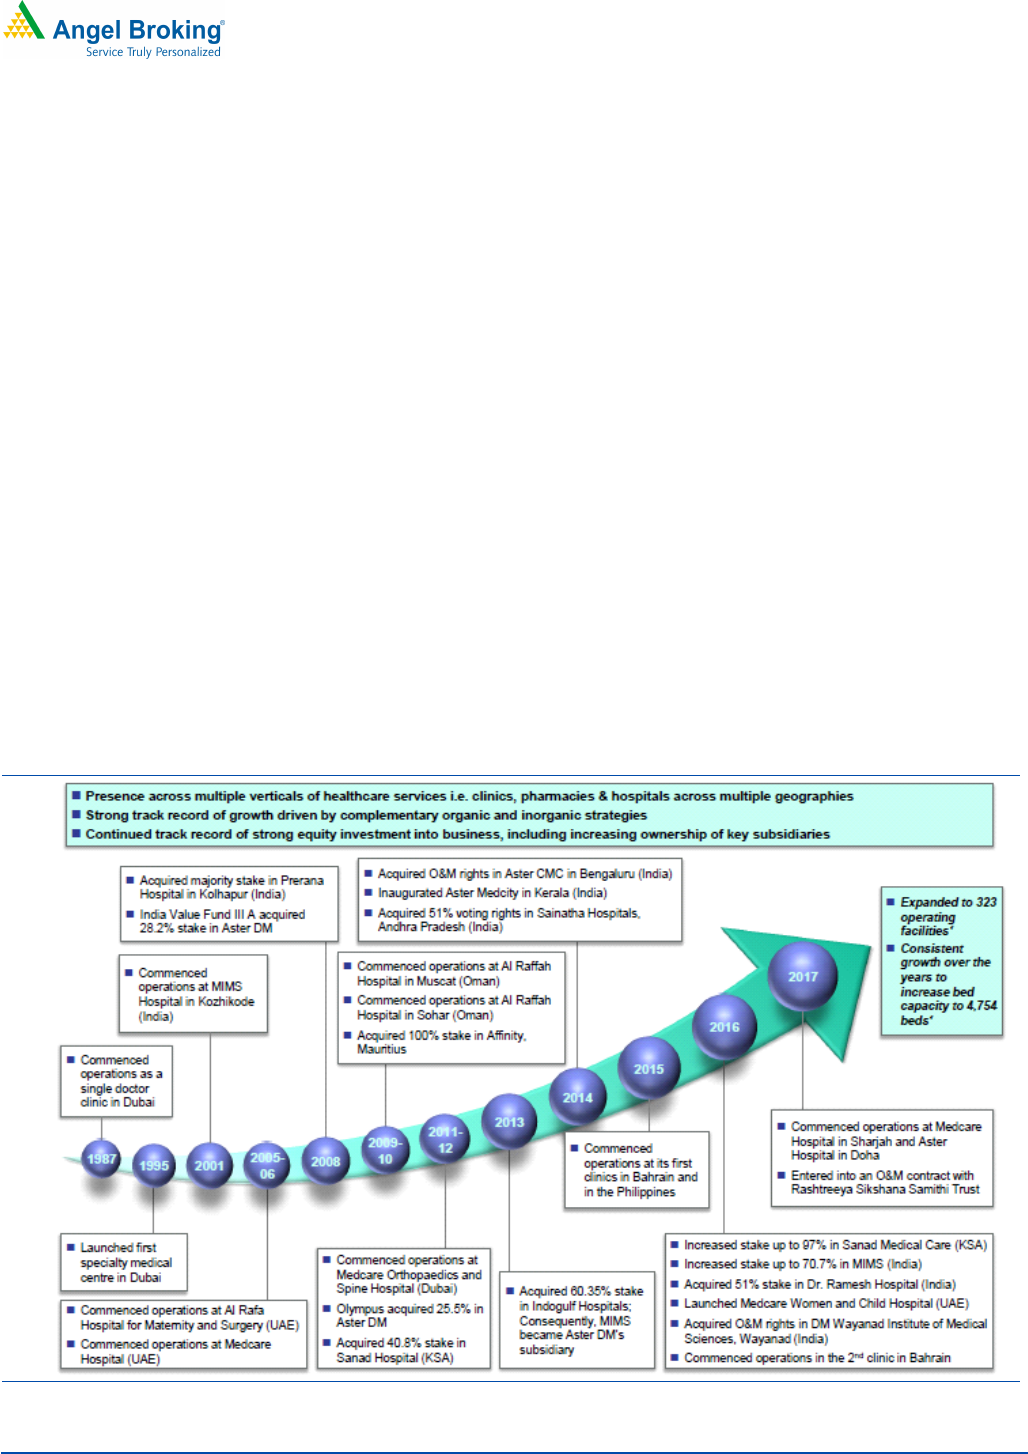
Exhibit 1: Evolution of Aster DM
Source: Company, Angel Research

Aster DM Healthcare Limited |
IPO Note
Feb 08, 2018
3
Issue details
ADHL’s IPO is a mix of offer-for-sale and fresh issue of shares. The issue would
constitute fresh issue of shares worth `725cr, with offer-for-sale of 1.3cr shares.
The company will dilute 7.6% of its post-offer paid-up equity share capital.
Exhibit 2: Pre and Post-IPO shareholding pattern
(No. of share) Pre-Issue
(%)
Pre-Post
(%)
Promoters
202,134,341
43.3%
188706090
37.4%
Others
264,935,110
56.7%
316521256
62.6%
467,069,451
100.0%
505227346
100.0%
Source: Source: RHP, Note: Calculated on upper price band
Objects of the offer
The objects of the Offer for the Company are to:
Repayment and/or pre-payment of debt (`564cr)
Purchase of medical equipment (`110cr); and
General corporate purposes
Key Risk
Aggressive expansion plan would improve the revenue visibility which can
pose upside risk
Higher attrition of reputed doctors can have an impact on the financials
Increase in competition from other players can impact the business of
company
High geographical concentration in GCC countries which can increase
risks for company

Aster DM Healthcare Limited |
IPO Note
Feb 08, 2018
4
Consolidated Income Statement
Y/E March (` cr) FY2015 FY2016 FY2017
1HFY18
Total operating income 3,876 5,250
5,931
3,123
% chg - 35.5 13.0
-
Total Expenditure 3,370 4,804
5,599
2,944
Raw Material 1,222 1,623
1,887
973
Personnel 1,154 1,629
2,055
1,128
Others Expenses
994
1,552
1,657
844
EBITDA
506
446
332
178
% chg - (11.9)
(25.5)
-
(% of Net Sales) 13.1 8.5 5.6 5.7
Depreciation& Amortization
144
243
322
174
EBIT
362
203
10 5
% chg - (44.1)
(95.2)
-
(% of Net Sales) 9.3 3.9 0.2 0.1
Interest & other Charges 79
189
354
89
Other Income 23 25 37
19
(% of PBT) 7.6 67.2 12.7
(28.4)
Exceptional Items -
-
596.1
-
Share in profit of Associates
0 (1) (0) (0)
Recurring PBT
306
38
289
(66)
% chg (87.7) 666.8
-
Tax 34 29 22
17
(% of PBT) 11.2 78.2 7.6
(25.0)
PAT (reported) 272.1 8.2
266.7
(82.7)
% chg - (97.0) 3,148.7
-
(% of Net Sales) 7.0 0.2 4.5 (2.6)
Basic EPS (`)
6.7
0.2
6.6
(2.1)
Fully Diluted EPS (`)
6.7
0.2
6.6
(2.1)
% chg (97.0) 3,148.7
Source: RHP, Angel Research

Aster DM Healthcare Limited |
IPO Note
Feb 08, 2018
5
Consolidated Balance Sheet
Y/E March (` cr)
FY2015
FY2016 FY2017
1HFY18
SOURCES OF FUNDS
Equity Share Capital
389
403
403
403
Reserves& Surplus
1,857
194
1,847
1,774
Shareholders Funds
2,246
597
2,251
2,177
Total Loans
901
3,162
2,807
2,957
Deferred Tax Liability
135
156
169
170
Total Liabilities
3,282
3,914
5,227
5,304
APPLICATION OF FUNDS
Net Block
1,785
2,037
2,767
2,966
Capital Work-in-Progress
197
358
290
233
Investments
3
39 22
26
Goodwill
452
470
753
750
Current Assets
1,965
2,822
2,936
3,072
Inventories
311
411
526
543
Sundry Debtors
884
1,342
1,288
1,488
Cash
304
267
152
127
Loans & Advances
-
-
-
-
Other Assets
465
802
971
914
Current liabilities
1,130
1,842
1,581
1,790
Net Current Assets
835
980
1,355
1,282
Deferred Tax Asset
10
30 40
47
Total Assets
3,282
3,914
5,227
5,304
Source: RHP, Angel Research

Aster DM Healthcare Limited |
IPO Note
Feb 08, 2018
6
Consolidated Cash Flow Statement
Y/E March (` cr)
FY2015
FY2016 FY2017 1HFY2018
Profit before tax
306
38
(307)
(66)
Depreciation
144
243
322
174
Change in Working Capital
(490)
(681)
(154)
(89)
Interest / Dividend (Net)
0
7 0 0
Direct taxes paid
(22)
(34)
(44)
(22)
Others
298
629
549
126
Cash Flow from Operations
236
203
366
123
(Inc.)/ Dec. in Fixed Assets
(395)
(744)
(925)
(201)
(Inc.)/ Dec. in Investments
(53)
(42)
(228)
(56)
Cash Flow from Investing
(448)
(786)
(1153)
(257)
Issue of Equity
(395)
(744)
(925)
(201)
Inc./(Dec.) in loans
212
2422
876
155
Dividend Paid (Incl. Tax)
(17)
(49)
(16)
(7)
Finance charges paid
(80)
(89)
(174)
(92)
Others
482
(961)
887
202
Cash Flow from Financing
203
578
648
56
Inc./(Dec.) in Cash
(10)
(5)
(138)
(79)
Effect of exch diff on cash
9
10 16 (0)
Opening Cash balances
248
248
253
131
Closing Cash balances
248
253
131
52
Source: Company, Angel Research

Aster DM Healthcare Limited |
IPO Note
Feb 08, 2018
7
Exhibit 3: Key Ratios
Y/E March FY2015
FY2016
FY2017
Valuation Ratio (x)
P/E (on FDEPS)
28.2
933.0
28.7
P/CEPS
18.4
30.5
13.0
P/BV
3.4
12.8
3.4
Dividend yield (%)
0.0
0.0
0.0
EV/Sales
2.1
2.0
1.7
EV/EBITDA
16.1
23.4
30.3
EV / Total Assets
2.5
2.7
1.9
Per Share Data (Rs)
EPS (Basic)
6.7
0.2
6.6
EPS (fully diluted)
6.7
0.2
6.6
Cash EPS
10.3
6.2
14.6
Book Value
55.7
14.8
55.8
Returns (%)
ROCE
11.5
5.4
0.2
Angel ROIC (Pre-tax)
13.2
6.1
0.2
ROE
12.1
1.4
11.9
Turnover ratios (x)
Inventory / Sales (days)
29
29
32
Receivables (days)
83
93
79
Payables (days)
41
48
48
Working capital cycle (ex-cash) (days)
72
73
63
Source: Company, Angel Research

Aster DM Healthcare Limited |
IPO Note
Feb 08, 2018
8
Research Team Tel: 022
-
39357800 E
-
mail: research@angelbroking.
com Website:
www.angelbroking.com
DISCLAIMER
Angel Broking Private Limited (hereinafter referred to as “Angel”) is a registered Member of National Stock Exchange of India Limited,
Bombay Stock Exchange Limited and Metropolitan Stock Exchange Limited. It is also registered as a Depository Participant with CDSL
and Portfolio Manager and investment advisor with SEBI. It also has registration with AMFI as a Mutual Fund Distributor. Angel Broking
Private Limited is a registered entity with SEBI for Research Analyst in terms of SEBI (Research Analyst) Regulations, 2014 vide
registration number INH000000164. Angel or its associates has not been debarred/ suspended by SEBI or any other regulatory
authority for accessing /dealing in securities Market. Angel or its associates/analyst has not received any compensation / managed or
co-managed public offering of securities of the company covered by Analyst during the past twelve months.
This document is solely for the personal information of the recipient, and must not be singularly used as the basis of any investment
decision. Nothing in this document should be construed as investment or financial advice. Each recipient of this document should
make such investigations as they deem necessary to arrive at an independent evaluation of an investment in the securities of the
companies referred to in this document (including the merits and risks involved), and should consult their own advisors to determine
the merits and risks of such an investment.
Reports based on technical and derivative analysis center on studying charts of a stock's price movement, outstanding positions and
trading volume, as opposed to focusing on a company's fundamentals and, as such, may not match with a report on a company's
fundamentals. Investors are advised to refer the Fundamental and Technical Research Reports available on our website to evaluate the
contrary view, if any.
The information in this document has been printed on the basis of publicly available information, internal data and other reliable
sources believed to be true, but we do not represent that it is accurate or complete and it should not be relied on as such, as this
document is for general guidance only. Angel Broking Pvt. Limited or any of its affiliates/ group companies shall not be in any way
responsible for any loss or damage that may arise to any person from any inadvertent error in the information contained in this report.
Angel Broking Pvt. Limited has not independently verified all the information contained within this document. Accordingly, we cannot
testify, nor make any representation or warranty, express or implied, to the accuracy, contents or data contained within this document.
While Angel Broking Pvt. Limited endeavors to update on a reasonable basis the information discussed in this material, there may be
regulatory, compliance, or other reasons that prevent us from doing so.
This document is being supplied to you solely for your information, and its contents, information or data may not be reproduced,
redistributed or passed on, directly or indirectly.
Neither Angel Broking Pvt. Limited, nor its directors, employees or affiliates shall be liable for any loss or damage that may arise from
or in connection with the use of this information.